The Value of SEO: Which Metrics Indicate the Success of a Promotion Strategy
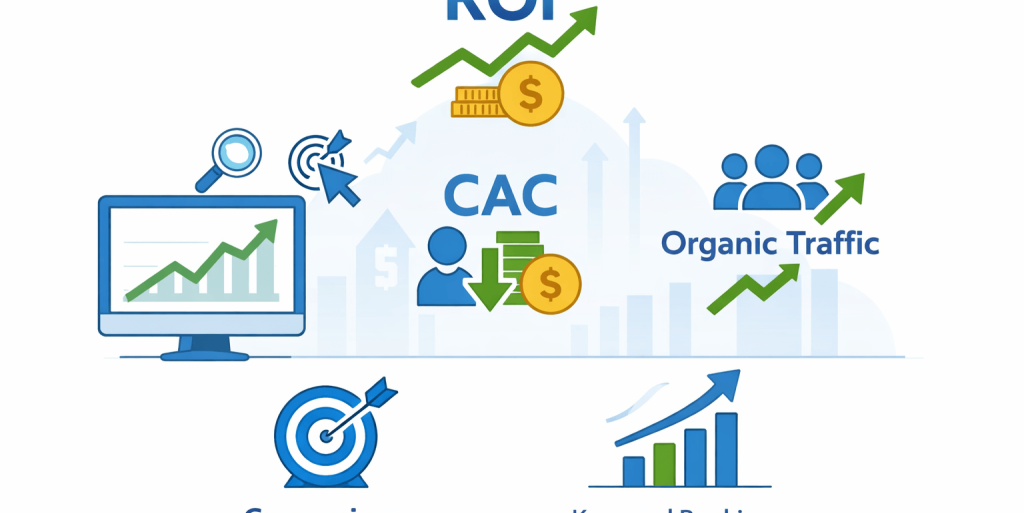
Although SEO has been around for over 30 years, many companies still view it as an expense rather than an investment. After all, if it is an investment, it is possible to calculate its key performance indicators (KPIs), including return on investment (ROI), customer acquisition cost (CAC) and so on. But how do you go about it? If you’re also wondering how to measure SEO effectiveness, this article is for you. We explain complex concepts in simple terms, with an analysis of metrics, formulas and practical recommendations.
What are KPIs in SEO
KPIs for SEO are metrics that show the results of promotion in figures and percentages. They help you see quantitative and qualitative changes in real terms. These indicators can be compared with previous periods, the start of the project, competitors’ successes and planned targets.
KPIs highlight aspects that aren’t immediately apparent:
- the website’s strengths and weaknesses;
- the dynamics of changes;
- audience behaviour;
- the effectiveness of implemented changes.
Furthermore, performance indicators serve as a universal language of communication between the website owner and the SEO agency or freelancer responsible for promotion. Using these metrics, you can clearly determine how successful the collaboration is, what the project’s immediate and long-term goals are, and how close you are to achieving them.
What are the key SEO performance indicators?
There are quite a few of these indicators. To make them easier to understand, they can be divided into financial and non-financial metrics. The former help to assess the return on marketing investment. The latter show how successfully you are engaging with users. Let’s start with the non-financial metrics, as they form the basis for a general understanding of effectiveness.
Non-financial metrics
Is your website being seen by your target audience, and if so, in which positions? Do users like the website? Is it easy for them to perform the desired action? These questions can be answered using the following metrics.
Volume and quality of target traffic
The volume of organic traffic shows how many users came to you from search (non-advertising) results. At first glance, this is the simplest quantitative metric. However, in analytics systems, it can be segmented by location, gender, age and user devices. This helps to compare how closely the actual audience matches the target audience. Furthermore, this metric helps to track the dynamics of SEO traffic and link it to changes in the current SEO strategy.
Rankings for target keywords
This is a comprehensive set of metrics, and with their help we can see the full picture of the website’s rankings in search results. For example, the positions in which pages appear for priority keywords; which queries are affected by seasonality; and what percentage of the semantic core results in a top-10 ranking. Since it is initially easier to achieve high rankings for low-competition keywords, visibility within the semantic core also helps identify priority keywords for further growth.
Behavioural factors
Another sign that SEO is moving the project in the right direction is improved user engagement with the site. This can be tracked using the following behavioural factors.
CTR
Click-Through Rate – the ratio of clicks on your snippet to its impressions in the search results. It reflects the relevance of the title and description, and their ability to attract interest and motivate users to visit the site.
In other words, if 100 people saw your site in the search results and 5 clicked through, the CTR would be 5. But what does this mean for your business? If you’ve only just started your SEO campaign, you can use average CTR figures across different niches as a guide:
- travel: 9.19%,
- sport: 8.82%;
- e-commerce: 5.50%;
- catering: 7.60%;
- property: 8.55%;
- health and fitness: 6.15%;
- finance: 5.70%;
- beauty sector: 5.92%.
However, it is also worth bearing in mind that these metrics may vary depending on geography, the season, the current economic climate and global trends.
Return to search
The lower this figure is, the more users were satisfied with their visit to your site and did not return to the search results. A high value highlights the problem of the page being irrelevant to the user’s query.
Decision time
The lower the value, the more trustworthy the snippet is. If a user hesitates over whether to click on your site or not, it means the resource has worthy competitors or the user does not see a clear benefit in the snippet.
Time on site and page depth
These show how long a person stays on your site and how many pages they visit. However, high figures are not always the benchmark; for example, for single-page sites or small business card sites, these values will be low.
Bounce rate
Shows the percentage of visitors who leave immediately after landing on the page, i.e. visitors who realised straight away that the site would not meet their needs. This suggests there may be issues with the structure, usability, or that the page content does not match the snippet.
Behavioural factors can highlight a website’s strengths and weaknesses: identifying issues with content, structure, usability, and so on. And positive trends in these areas directly influence the growth of key performance indicators.
Interested in SEO?
Order SEO services from SEOGeeks today and get a 6-month strategy for free!
Key Performance Indicators
How can you assess the effectiveness of SEO in terms of financial results? This is where key performance indicators come into play. They are useful for marketers, analysts and decision-makers responsible for allocating budgets, particularly when considering the return on marketing investment.
Conversions from organic traffic
Whilst an increase in organic traffic can be seen as a positive sign, an increase in conversions is direct confirmation of the effectiveness of SEO.
Conversion is the ratio of visitors who have performed a target action (subscribing to a newsletter, registering, requesting a callback, making a purchase, etc.) to the total number of website visitors.
Conversions are calculated using the formula: number of target actions ÷ number of visits × 100
Cost per click
Cost Per Click (CPC) can be calculated for both organic and paid traffic. The formula is the same: CPC = Promotion costs (SEO or contextual advertising) ÷ number of clicks (organic or paid, respectively).
By calculating the metrics for both marketing channels, you can compare their effectiveness and reallocate the budget if necessary. Since SEO, unlike paid search advertising, does not yield immediate results, it makes sense to compare these metrics over a longer period of time (3–6 months).
Cost per lead
Similarly to the previous metric, you can calculate the cost per lead for paid search and SEO. In this case, we are not interested in all visitors, but only those who reached the target event.
Cost Per Lead is calculated using the formula: CPL = budget ÷ number of leads.
CPL can be calculated separately for SEO and contextual advertising, as well as for the entire website. Most often, the trends in CPC and CPL will be similar. If, however, a lead turns out to be expensive despite a low cost per click, this is a sign that the traffic is not converting well. This means there are aspects of the website that need improving. For example, the structure, navigation, content, prices, order form, etc.
Return on Investment
The results of any marketing channel can be realistically assessed using the ROI (Return on Investment) metric.
To do this, we use the formula: ROI = (revenue from the channel – expenditure) ÷ expenditure × 100
Unlike all the previous metrics, this one is calculated solely by the client, as they have full access to internal financial data.
Initially, the ROI will be negative. However, as traffic, conversions and leads grow, a positive trend will emerge. The time it takes for ROI to turn positive depends on the competitiveness of the niche, the seasonality of the business, overall marketing costs and other factors.
On average, this can take between 6 and 12 months. The highest values are achieved in sectors such as property, fintech and industrial technology.
Additional metrics
The best metrics to track depend on the industry and the specific nature of the business. Sometimes it is sufficient to calculate ROI alone, whilst at other times several KPIs are required for a more accurate assessment. Additional metrics can also be used for a more in-depth analysis of the effectiveness of SEO and other channels.
AI visibility
With users rapidly switching to AI assistants, it is important to track more than just search rankings and website visibility in search engines. Mentions by AI assistants and appearances in Google AI Overviews are also significant. Good AI visibility is an indicator of brand recognition and trust, and one of the sources of high-quality traffic.
Globally, AI traffic in 2025 grew by 527% compared to the previous year. Some companies confirm that over 1% of their sessions come from ChatGPT, Perplexity and Copilot. This is still a small figure, but this trend should not be ignored.
Social signals
These are the audience’s reactions on social media to a brand’s content. Social signals are not a 100% reliable SEO metric, but they can indicate that users like the content and are willing to share it, including by providing high-quality backlinks.
Volume of brand traffic
An increase in brand traffic from search engines indicates that users are specifically searching for your company or product. This is an excellent indicator of brand recognition. However, this is usually down not only to SEO, but also to other channels: contextual advertising, SMM, crowd marketing, etc.
Average order value
The average order value can serve as a performance indicator for online shops.
The formula is quite simple: average order value = total revenue ÷ number of orders.
The result will show how much a single customer spends on average and how profitable it is to attract the target audience. This metric is useful for tracking financial results as your SEO strategy evolves. It helps assess whether a new strategy is performing better or worse and which changes are leading to new financial outcomes.
Tools for analysing SEO performance
There are several useful tools available for tracking SEO metrics. Here we highlight the most user-friendly and informative ones.
GA4
Google Analytics provides detailed reports on traffic volume and sources, conversions, and user engagement with the website. It is a handy tool for analysing the sales funnel – from the first interaction with the website to the target event. GA4 provides user-friendly visual reports, period comparisons and a wide range of features for SEO and PPC specialists.
Google Search Console
This service allows you to check page rankings, changes in positions for key queries, and top Google impressions. You can also assess the technical condition of the website here, which will help formulate recommendations for optimisation.
SE Ranking
The platform’s functionality covers a wide range of non-financial metrics and KPIs. Here, you can analyse keyword rankings, backlink profiles, and promotion results across different regions and search engines. This service is also suitable for comparing your performance against competitors.
Ahrefs
SEO metrics can also be analysed using Ahrefs. The service is suitable for analysing content, keywords and assessing organic traffic. It is often used not only to evaluate the effectiveness of one’s own strategy, but also to study competitors’ strategies.
How to measure the effectiveness of website promotion

If the project is small, the metrics listed above can be used in their basic form, without in-depth analysis. However, if the project is large-scale and requires identifying effective SEO goals and KPIs, reallocating budgets, and comparing the results of different marketing channels, a more complex approach will be needed.
Here are a few ways to carry out such an analysis:
- Comparing the cost per lead in paid search and SEO.
- Comparing the same metrics across different periods, taking into account the influence of various factors: changes in strategy, seasonality, the emergence of new competitors, etc.
- Comparing budgets for different SEO components: link building, content creation, and on-page optimisation. You can also check how SEO metrics change when budgets are reallocated.
- Analysing SEO’s contribution to the overall marketing strategy. If a company also invests in SMM, PR, and offline events, it is important to track the benefits of each channel. To do this, alongside core metrics, additional indicators such as brand traffic and social signals are useful.
Analytics is indeed a vital part of SEO. KPIs serve as a kind of universal language for communication between different departments within the company (marketing, sales, analytics), as well as between the company and its outsourcing partners. When working with clients, we pay particular attention to reports, presenting them in a clear visual format in Looker Studio, comparing goals with current results and identifying the strongest areas
FAQ
Answers to frequently asked questions
This can be done using SEO metrics. Organic traffic volume, search rankings, conversions, and lead cost – compare these figures with previous periods when optimisation work was not being carried out or had only just begun.
Changes in SEO metrics will tell you. For example, a steady rise in search rankings and organic traffic, coupled with an increase in conversions, a reduction in lead cost and cost per click, and a positive trend in ROI.
The most popular metrics are: traffic volume, search rankings, CTR, time on site, bounce rate, page depth, conversions, cost per click and cost per lead, and return on investment.
The most popular formulas:
Conversions. CR = number of target actions ÷ number of visits × 100
Cost per click. CPC = Marketing expenditure ÷ number of clicks
Cost per lead. CPL = budget ÷ number of leads
Return on investment. ROI = (revenue – expenditure) ÷ expenditure × 100
Services such as Google Analytics, Google Search Console, SE Ranking and Ahrefs are suitable for analysing effectiveness.